Introduction to Inflation

Introduction to Inflation

The value of the dollar has declined dramatically over time thanks to inflation. Inflation is caused when the central bank (the Federal Reserve in the United States) allows the amount of money in circulation to grow too fast, or equivalently, if the central bank sets interest rates too low. Inflation causes the value of your money to decline, so you bear a direct cost. As we will see in my next series of blogs, inflation causes other problems in the economy that are severe, but are not felt directly by most people.


What Does a Dollar Buy Today?

When inflation occurs, prices of goods rise, on average. So, a dollar buys less than it used to buy. How much is a dollar worth today, compared to the past?


It takes this many dollars today          $2         $3      $4       $5       $6

To buy what $1 bought in this year    1985    1978   1974    1970    1965


As the table suggests, a dollar buys nowhere near what it used to. It now takes $6 to buy what $1 bought in 1965.

The data in the table are calculated by the federal government’s Bureau of Economic Analysis and come from a measure of prices called the Personal Consumption Expenditure price index, which shows the average price of goods and services purchased by consumers in the United States. This particular price index is superior to the more common Consumer Price Index, which is biased upwards and constructed in an inefficient manner. Compiling an accurate measure of prices is quite difficult because of changes in the quality of goods and the fact that people change their tastes for different types of goods. The Personal Consumption Expenditure price index that we use in this chapter has fewer problems than any of the various indexes that the government produces.

The price index shows how much the average price of goods and services has changed over time. To get an idea of how much prices have changed in a year, we can calculate the inflation rate as the percentage increase in the price index from one year earlier. The chart below shows the results of this calculation from 1960 to 2016.

inflation_pcepi

Chart: Inflation Rate, Consumer Prices

Source: Author’s calculations, based on Bureau of Economic Analysis data on personal consumption expenditures price index.


In the chart, you can see that inflation in the early 1960s was very low. But inflation began to rise steadily in the late 1960s and into the early 1970s. Then, from 1974 to 1975, inflation jumped to double-digit levels. Inflation dropped for a short time later in the 1970s, but jumped up again in 1979 and 1980. Inflation began to decline in the early 1980s, rose a bit in the late 1980s, and then declined to below 2 percent in the 1990s. The 2000s saw volatility in inflation, though on average inflation remained fairly low. The inflation rate was negative for a short time in 2009, mainly because of a sharp decline in prices during the financial crisis. More recently, the inflation rate has remained below 2 percent, which is sometimes thought to be the optimal rate of inflation (more on that in a future blog).

Adjustable-Rate Mortgages (Part 3)

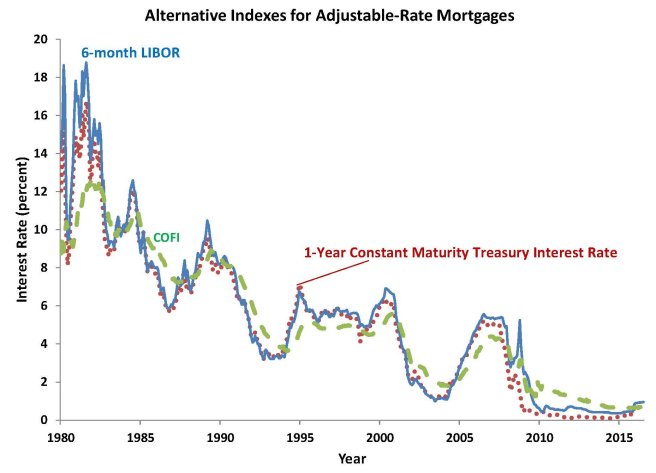
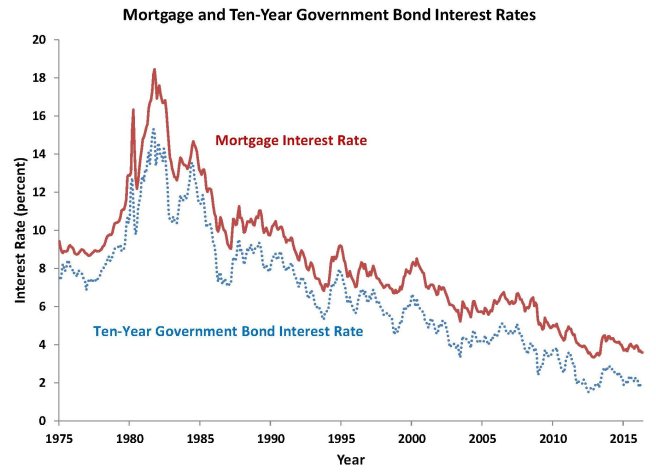
In the two previous blogs on adjustable-rate mortgages, we discussed various indexes that are used to determine the interest rate on an adjustable-rate mortgage and we compared the interest rates on adjustable-rate mortgages to those on fixed-rate mortgages. In the last blog, we showed a chart that gave you an idea about how to compare the interest rates on the two types of mortgages over time. But it isn’t a very good chart to answer a key question: at any date, would I have been better off with a fixed-rate mortgage or a variable-rate mortgage? That is a more complicated question because it depends, in large part, on how long you plan to keep your house and how expensive it is to refinance your mortgage. Let’s think about two different scenarios and show you when you would have been better off with a fixed-rate mortgage versus a variable-rate mortgage. We’ll compare a fixed-rate mortgage of $100,000 at each date to a variable-rate mortgage in which your index is the one-year constant-maturity Treasury rate with a margin of 2.5 percentage points, with a 2 percentage point annual cap and a 5 percentage point lifetime cap, with a fixed initial teaser rate for 3 years that gives you a 1 percentage point lower initial rate. In scenario A, we’ll assume you keep your home for 10 years; whereas in scenario B, we’ll assume you keep your home for 20 years. If you save money on one mortgage versus the other, we assume that you will invest it in a one-year Treasury security, which has a similar yield to many other safe investment opportunities.

The results, shown in this new chart, are a bit of a surprise because they show that homeowners would have been better off with adjustable-rate mortgages rather than fixed-rate mortgages, if they had bought their houses any time after 1980.

net-profit-for-fixed-vs-adjustable-rate-mortgages

Chart: Net Profit from Adjustable-Rate Mortgage Over Fixed-Rate Mortgage

Source: Author’s calculations, based on Federal Reserve Board data on 1-year constant maturity Treasury interest rate; Federal Reserve Board data on fixed-rate mortgage rate


Here’s how to read the graph. The origination date (when the house was purchased) is shown on the horizontal axis. The vertical axis shows the net profit from having an adjustable-rate mortgage rather than a fixed-rate mortgage, adjusted for inflation, in thousands of dollars. We consider a family keeping a house for 10 years or 20 years. A positive net profit for a line on the graph shows that someone getting a mortgage at the date on the horizontal axis would have been better off with an adjustable-rate mortgage; a negative net profit means the person would have been better off with a fixed-rate mortgage.

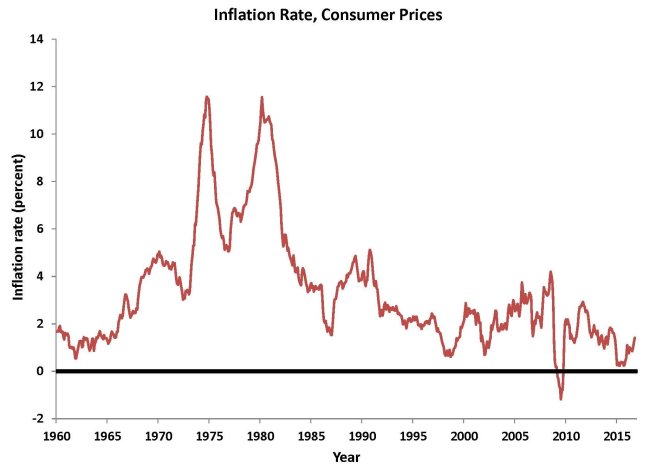
You can see that the turning point is the period when inflation was at its highest, in about 1980. Anyone who got a mortgage before that date would have been better off with a fixed-rate mortgage. For example, a family that took out a mortgage loan in 1973, stayed in its house for 20 years, and had a fixed-rate mortgage, would have been $200,000 better off in 1993 than a similar family that had an adjustable-rate mortgage. But starting in 1980, which is the period in which the inflation rate peaks and then begins to decline, an adjustable-rate mortgage gives a net profit over a fixed-rate mortgage. For example, a family that took out a $100,000 mortgage in 1981, stayed in its house for 20 years, and had an adjustable-rate mortgage, would have been $280,000 better off in 2001 than a family that had a fixed-rate mortgage.

However, once we get into more recent periods, we see a pattern that is not surprising: adjustable-rate mortgages provide a small net profit over fixed-rate mortgages. This is not surprising because an adjustable-rate mortgage is riskier than a fixed-rate mortgage to the homeowner. The compensation for taking such a risk is the net profit. So, here is the bottom line: you can save money, on average, by getting an adjustable-rate mortgage, but it is riskier than having a fixed-rate mortgage. If the inflation rate increases after you get your mortgage, which is the main factor raising mortgage interest rates, then you will be better off with a fixed-rate mortgage. That’s the result we see in the chart for mortgages that were originated in the 1970s. But, if the inflation rate stays the same or decreases after you get your mortgage, then you will be better off with an adjustable-rate mortgage.

In recent years, the Federal Reserve has committed to keeping the inflation rate low and stable, as we will discuss in a later blog. If you believe that their commitment is credible, then you may want to get an adjustable-rate mortgage. But you must be aware of the risk that your monthly payment could rise. If your budget is tight, you will probably be better off with a fixed-rate mortgage to avoid that risk. And the net profit from having an adjustable-rate mortgage stayed pretty low for mortgages originated in the 1990s and early 2000s, so the cost of having a fixed-rate mortgage instead of an adjustable-rate mortgage is not great.

Refinancing

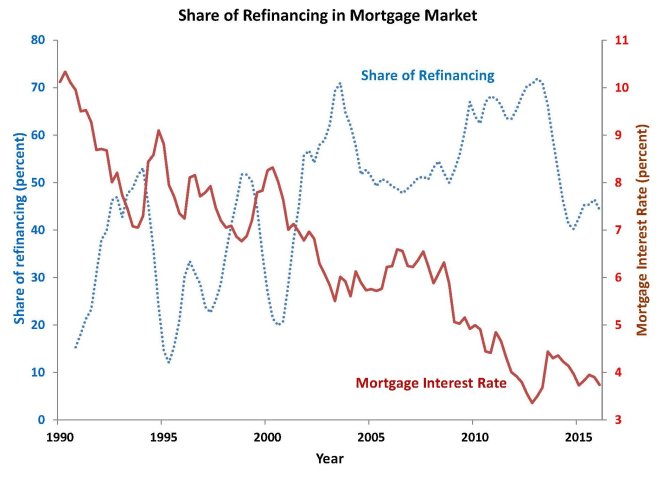
The analysis that we discussed above is not entirely foolproof because it did not consider the possibility of refinancing a mortgage. Had you taken out a fixed-rate mortgage in 1981, for example, you most likely would have refinanced it a few years later when interest rates declined. So, one additional consideration that we did not account for in the chart was the likelihood that someone would refinance. Thus, the net profits plotted in the chart are higher than would actually be the case. Still, the chart shows you the net profit if you never refinanced your mortgage. Of course, refinancing can be expensive, but should certainly be done if you have a fixed-rate mortgage at a high rate and you can lower your rate and your monthly payment.

Predicting Interest Rates

You might think that one way to choose between getting an adjustable-rate mortgage or a fixed-rate mortgage is just a matter of forecasting interest rates. In fact, if you could forecast interest rates better than other people, you could make a good choice. But remember that lenders are also forecasting interest rates. Unfortunately for both lenders and borrowers, interest rates are extremely difficult to forecast more than a year or two ahead, which is much too short a time to be of value in choosing a 30-year mortgage.

Adjustable-Rate Mortgages (Part 2)

In the previous blog on adjustable-rate mortgages, we discussed various indexes that are used to determine the interest rate on an adjustable-rate mortgage. But there is also a second piece of information that determines the interest rate on your loan: the margin. If you add the margin to the index rate, that is your mortgage interest rate. A typical margin is about 2.5 percent, though lenders may require a higher margin if your credit rating is poor. (Your credit rating depends on your past history of making payments on time on your loans, the size of your loan balances, your ability to pay, and so on. We’ll talk more about credit ratings in a future blog.)

Here is an example of how your interest rate is determined. Suppose your index rate is the one-year constant maturity rate, which is currently 0.5 percent. Suppose you have a margin of 2.5 percent. Then your mortgage interest rate is 0.5% + 2.5% = 3.0%. A typical adjustable-rate mortgage adjusts your interest rate once each year and your new monthly payment is based on that new rate.

There are some other factors to consider in choosing an adjustable-rate mortgage or a fixed-rate mortgage. First, many lenders will offer you a lower initial interest rate for a year or two on an adjustable-rate mortgage, which is sometimes called a “teaser” rate. Don’t be teased! For example, suppose your interest rate based on the formula in the preceding paragraph is 3.0 percent but your bank offers you a three-year teaser rate of 1.5 percent. Should you take it? The 1.5 percent rate for three years can save you a lot of money, but remember that you have another 27 years to pay. So, don’t be fooled by the initial low rate. You should figure out whether you can afford the loan based on the regular interest rate of 3.0 percent, as well as considering what might happen if the interest rate rises to an even higher level.

The second additional factor to consider is whether or not there are caps on the interest-rate adjustment. Although the basic formula for your interest rate each year is interest-rate = index rate + margin, sometimes interest rates rise (or fall) by 3 or 4 percentage points within a year. This can dramatically change your monthly mortgage payments. To reduce the risk of a very large change in the monthly mortgage payment that a homeowner might find difficult to handle, many loans have a built-in mechanism that: (1) keeps the interest rate from changing too much year to year and (2) keeps the interest rate from changing too much over the life of the loan. For example, a mortgage loan might have an annual cap of 2 percentage points and a lifetime cap of 5 percentage points. Then your rate would rise or fall at most by 2 percentage points each year and could never be more than 5 percentage points higher or lower than the initial interest rate.

Here is the difficult, but interesting part: at what times in the past would you have been better off with a fixed-rate mortgage as compared with an adjustable-rate mortgage? This is a very complicated calculation because each year the adjustable rate changes by an amount that is subject to the annual and lifetime caps. It’s also complicated by the fact that you could refinance your mortgage for a fee that usually amounts to one to two percentage points of the value of your mortgage. So, let’s just look first at a comparison of the interest-rate on a fixed-rate mortgage each month, compared with an adjustable-rate mortgage on the same date, where we will assume the adjustable rate is determined by the one-year Treasury constant maturity interest rate plus 2.5 percentage points. This will give you an idea of how variable the adjustable rate is compared with a fixed rate. The results are shown in the chart.

The chart shows you that adjustable rates and fixed rates move closely together. The adjustable rates change more from year to year. On average, the difference between the two is 0.4 percentage points—on average, adjustable rates are lower. That is logical because with an adjustable rate, you are bearing some of the risk of a change in market interest rates and the bank bears less risk; so, you are rewarded with a lower interest rate, on average. The other idea that you can get from the chart is that when interest rates are temporarily high, you are better off with an adjustable rate rather than a fixed rate because you will benefit when interest rates decline. When interest rates are temporarily low, you are better off with a fixed rate because you lock in the low rate.


arms-vs-frms

Chart: Comparing Fixed-Rate to Adjustable-Rate Mortgages

Source: Author’s calculations, adding 2.5% to Federal Reserve Board data on 1-year constant maturity Treasury interest rate; Federal Reserve Board data on fixed-rate mortgage rate

Adjustable-Rate Mortgages (Part 1)

An alternative to the standard fixed-rate mortgage is an adjustable-rate mortgage, also known as a variable-rate mortgage. With the standard fixed-rate mortgage, once you sign the mortgage agreement, your monthly payment is fixed for the life of the loan or until you sell the house or refinance it. An adjustable-rate mortgage is one in which your monthly payment can change over time.

Why would anyone ever want an adjustable-rate mortgage instead of a fixed-rate mortgage? There are two main reasons: (1) the mortgage interest rate might be high and you expect it to decline; and (2) on average, adjustable-rate mortgage interest rates are lower than fixed-rate mortgage interest rates. Since the early 1980s, the interest rate on fixed-rate mortgages has declined fairly steadily. As we will see, if you had bought a house in the early 1980s, you could have definitely profited by getting an adjustable-rate mortgage, which would have almost continuously adjusted downward. Generally, when the interest rate on fixed-rate mortgages is temporarily high, you may be better off with an adjustable-rate mortgage.

The way that adjustable-rate mortgages work is that they adjust your monthly payment every year (or sometimes every three years) depending on the movement of market interest rates. Many people don’t like that feature of adjustable-rate mortgages because they dislike the risk involved in not knowing what their mortgage payment will be. But if you can stand the risk, it can save you money. What you need to figure out is whether you can handle your monthly payment if interest rates go up and you have to pay more.

The interest rate on an adjustable-rate mortgage loan has two pieces: an index rate and a margin. Add the two and that is your interest rate. The index rate is an interest rate that moves with interest rates in the overall market. Examples include the one-year constant maturity Treasury index, the London Interbank Offered Rate (LIBOR), and the cost-of-funds index. Each represents a typical market interest rate. The one-year constant maturity Treasury index is a rate calculated by the Federal Reserve Board as the average interest rate on a Treasury bond with one year until it matures and the bond is paid off. LIBOR is the interest rate that banks in London pay each other for short-term loans in dollars; it is relevant for U.S. loans because there is a close tie between banks in the United States and in London, as they often enter into “swap” agreements to reduce their risk. A common index used for adjustable-rate mortgages is the 6-month LIBOR. The cost-of-funds index is the monthly weighted average cost of funds for savings institutions in the 11th district of the Federal Home Loan Bank.

The chart shows the movements of these rates over time. You can see that they all move fairly closely together, but there are some differences between them at various times. When interest rates in the overall market are declining, the cost-of-funds index is generally slower to decline than the other measures, as you can see in the mid-1980s, early 1990s, early 2000s, and from 2010 to 2013. When interest rates rise, the cost-of-funds index is usually slower to rise than the other indexes, as you can see in the early 1980s, 1994 to 1995, 1999 to 2000, and 2004 to 2006. The fact that the cost-of-funds index is slow to rise when other rates rise is good for borrowers in those times, but the fact that it is slow to fall when other rates fall is bad for borrowers in those times. On average, all the rates move together, so one particular rate is not better than the others. The one-year constant maturity Treasury rate and the 6-month LIBOR rate generally move closely together. A larger-than-normal discrepancy between them occurred in the financial crisis when LIBOR was set in an odd manner, which suggests that you might prefer to have the one-year constant maturity Treasury index or the cost-of-funds index for your adjustable-rate mortgage.

arm-indexes

Chart: Alternative Indexes for Adjustable-Rate Mortgages

Source: Federal Reserve Board data on 1-year constant maturity Treasury interest rate and LIBOR rate, Federal Home Loan Bank of San Francisco for COFI index

Refinancing Your Mortgage

In the 1950s and 1960s, mortgage interest rates didn’t change very much, so a typical homeowner bought a house, got a mortgage, and paid it off over 30 years. However, increased volatility of interest rates since the 1970s means that it is profitable to refinance your mortgage when the mortgage interest rate declines. Certainly, people who bought their homes in the 1980s when interest rates were above 10 percent should have refinanced their mortgage loans at some point. It only takes a small decline in the mortgage interest rate to make refinancing worthwhile. The difference in rates has to make a big enough difference in your monthly payments to make it worth the time, effort, and expense to refinance.

Almost everyone who took out a mortgage before 2009 could have profitably refinanced in 2011, 2012, or 2013. Mortgage interest rates dropped substantially from 2009 to 2013, so a homeowner is certain to pay less by getting a new mortgage than in sticking with the old mortgage. The cost of refinancing is generally about 1 percent of the total amount you are borrowing, but with a drop of 1 to 2 percentage points in the mortgage interest rate, refinancing will pay for itself within a year. So, why doesn’t everyone refinance? Part of the reason is that in the financial crisis, the value of many homes declined sharply, and banks will not refinance a mortgage loan for more than the home is worth. These days, banks are generally willing to only refinance your mortgage up to 80 percent of the home’s value, so the decline in home prices means that many homeowners will not be able to refinance their mortgages.

Given the ability of homeowners to refinance their mortgages, you can see why the percentage of the mortgage market that represents refinancing of existing mortgages (compared with financing new mortgages) rises as the mortgage interest rate declines. This relationship is shown in the chart. The blue dotted line shows that refinancing as a share of all mortgage loans is sometimes as low as 12 percent and as high as 72 percent. As the mortgage interest rate declined from 11 percent in 1990 to 3.5 percent in early 2013, the share of refinancing in the mortgage market generally increased. Whenever the mortgage interest rate rises appreciably, as it did in 1994, 1999, 2005, and mid-2013, you see that refinancing activity drops. And when the mortgage interest rate declines, many people refinance their homes and the market share of refinancing rises.

refinancing

Chart: Share of Refinancing in Mortgage Market

Source: Federal Reserve Board data on 30-year conventional mortgage interest rate, Mortgage Bankers Association share of refinancing

The Inflation-Adjusted Mortgage Interest Rate

In the previous blog, I showed you data on mortgage interest rates. But inflation has distorted some of the movements of these interest rates over time. You see much higher interest rates in the late 1970s and early 1980s than in other periods, which was caused by the higher inflation in that period. If we adjust for the difference in inflation by subtracting from the interest rate a measure of expected inflation, then we get a more accurate view of the cost of borrowing for a home, as the chart here shows.

Inflation-adjusted mortgage interest rate

Chart: Inflation-Adjusted Mortgage Interest Rate

Source: Federal Reserve Board data on 30-year conventional mortgage interest rate, adjusted by author for expected inflation using forecasts of inflation from Survey of Professional Forecasters, Federal Reserve Bank of Philadelphia


After adjusting for inflation, we can see that the mortgage interest rate is very low by historical standards today. After a lot of volatility in the mortgage interest rate in the 1980s, it settled down and averaged about 5 percent in the 1990s, then declined to a range of 3 to 4 percent in the early 2000s. After the financial crisis in 2008, the mortgage interest rate dropped dramatically to under 2 percent in 2011, reaching its all-time low at the end of 2012 of 1.1 percent. Most recently (as of the first quarter of 2016), the rate is 1.6 percent, still extremely low.

By adjusting the mortgage interest rate for expected inflation, we arrive at a measure that economists call the “real” interest rate, which is a more appropriate measure than the usual “nominal” interest rate. The nominal interest rate tells you how many dollars you have to pay to cover the interest on your mortgage loan. The real interest rate tells you, more appropriately, the amount of goods and services you need to forgo to cover the interest on your mortgage loan. For example, in the first quarter of 2016, the nominal interest rate was 3.7 percent, the long-term expected inflation rate was 2.1 percent, so the real interest rate was 3.7% – 2.1% = 1.6 percent. You expect to have to pay 3.7 percent more in dollar terms each year to cover the interest on your mortgage, but those dollars are expected to be worth 2.1 percent less each year, so the true cost in terms of goods and services you forgo to pay the interest on your loan is 1.6 percent each year.

Mortgage Interest Rates

The mortgage market is just one of many markets competing for funds in the overall marketplace for credit. As such, funds tend to flow across markets in response to increased demand. Interest rates in all markets are thus correlated, with differences depending on factors such as the risk to any particular sector of the economy. It turns out that the interest rate on mortgages is linked fairly closely to the interest rate on ten-year government bonds. The interest rate on 30-year mortgages averages about 1.7 percentage points above the interest rate on 10-year U.S. Treasury bonds, as Chart 4 shows. During the financial crisis, the difference between the two interest rates increased quite a bit because of the perceived risk to mortgage loans, ranging between 2 and 3 percentage points from November 2007 to March 2009, but has declined since. In May 2016, the interest rate on mortgages was about 3.6 percent, while the interest rate on 10-year government bonds was about 1.8 percent, so the 1.8 percentage point difference between the two was not much above the historical average of 1.7 percentage points.

Mortgage interest rates 2016 June

Chart: Mortgage and Ten-Year Government Bond Interest Rates

Source: Federal Reserve Board data on interest rates

Facts about the Mortgage Market

If we look at the total amount of mortgage debt outstanding as a percent of GDP (see chart), we see that it has grown steadily over time. Mortgage debt rose from 20 percent of GDP in 1955 to about 30 percent in 1965, and then stayed near 30 percent until 1985. In the 7 years from 1985 to 1992, mortgage debt grew another 12 percentage points to 42 percent of GDP. It didn’t rise much over the next 8 years, reaching 46 percent of GDP by 2000. But then the combination of low interest rates and sub-prime lending led mortgage debt to rise very sharply, hitting a peak of 73 percent of GDP in 2009. It has declined significantly since the financial crisis, dropping 21 percentage points from 2009 to 2015, standing at 52 percent of GDP in late 2015. But the level of mortgage debt outstanding relative to GDP is still far above where it was before 2000 when the housing boom accelerated, so it may still need to drop before the housing market is restored to full health.


1 mortgage chart 3 2016 June

Chart: U.S. Household Mortgage Debt as a Percent of GDP

Source: Federal Reserve Board data on mortgage debt, rescaled by author using GDP from Bureau of Economic Analysis

Facts About Housing Prices (continued)

From an economic point of view, Chart 1 (in the last blog) is a bit misleading because a dollar in 1975 is worth a lot more than a dollar in 2015, thanks to inflation. To adjust for inflation, we can use a measure of consumer prices. The resulting chart of inflation-adjusted home prices (Chart 2) gives a different picture than Chart 1. You can see that, in inflation-adjusted terms, housing prices grew rapidly in the second half of the 1970s, were fairly stable in the 1980s and early 1990s, and then began rising rapidly again in the second half of the 1990s until 2007. But, beginning early in 2007, inflation-adjusted home prices began to decline substantially. Over the five-year period from the peak in 2006 to their low point in 2012, inflation-adjusted home prices declined an average of 6 percent per year.

The data in Chart 2 can also be used to answer the question: is investing in a home a good financial investment? The answer is a clear NO! Using the data and calculating the inflation-adjusted annual return on homeownership, from 1975 to 2015, home prices rose only 1 percent per year, far less than stocks and bonds over the same period. Even at their peak in 2006, inflation-adjusted home prices had appreciated only 2 percent per year. So, if you buy a home, you are buying it because it provides shelter, not because it is a great financial investment.

1 mortgage charts 1 & 2 home prices 2016 May chart 2

Chart 2: U.S. Home Prices (Inflation-Adjusted)

Source: Federal Housing Finance Agency (FHFA) All-Transactions Home Price Index, rescaled by author and adjusted for inflation using personal consumption expenditures price index from Bureau of Economic Analysis

Facts about Housing Prices

In the housing bubble in the early to mid-2000s, sensible ideas about how much debt a home buyer should take on were ignored by everyone—bankers and homeowners. Both foolish lenders and greedy homeowners were swayed by the fact that home prices had been increasing substantially over the past 10 years. If we look at Chart 1 showing quarterly data on national housing prices, you can see why they might be fooled. The chart plots a measure of prices of homes nationwide from 1975 to 2015. In the chart, you can see that until 2007, national house prices had never declined for more than one quarter in a row, and had increased in every year; so both lenders and homeowners were fooled into thinking that homes were a safe asset. Second, the appreciation in house prices from 2000 to 2005 averaged 8% per year. This led lenders and homeowners into falsely thinking that a homeowner’s income and ability to pay were no longer relevant. After all, if the home appreciated by 8% per year, it would be easy to sell the home and pay off the mortgage without a loss to either side. So, lenders started making sub-prime loans, which allow people to qualify for loans at percentages well below standard rules, such as those that limit the monthly housing payment to be less than 28 percent of a household’s income, and limit the total of a household’s monthly housing payment and payment on other debts (credit cards or student loans) to be less than 36 percent of its income. Some loans were even known as NINJA loans (because the homeowner had No Income, No Job, and no Assets). Those loans relied entirely on the appreciation of the home to be valid; as the home appreciated in value, the homeowner would borrow even more to pay off the original mortgage loan. But all of this sub-prime lending turned out to be foolish because it relied on the continued appreciation of house prices. When home prices began to decline in 2007, panic set in. Everyone began to realize that these loans would never be paid off. The worst part of the story is that sub-prime loans had the potential to greatly increase the homeownership rate among low-income households, but after the bubble burst, that dream vanished. So, the main benefit of allowing sub-prime lending in the first place, which was to increase homeownership among the poor, actually made things worse.

#UsingEconomics

Chart 1: U.S. Home Prices

Source: Federal Housing Finance Agency (FHFA) All-Transactions Home Price Index, rescaled by author

1 mortgage charts 1 & 2 home prices 2016 May