If we look at the total amount of mortgage debt outstanding as a percent of GDP (see chart), we see that it has grown steadily over time. Mortgage debt rose from 20 percent of GDP in 1955 to about 30 percent in 1965, and then stayed near 30 percent until 1985. In the 7 years from 1985 to 1992, mortgage debt grew another 12 percentage points to 42 percent of GDP. It didn’t rise much over the next 8 years, reaching 46 percent of GDP by 2000. But then the combination of low interest rates and sub-prime lending led mortgage debt to rise very sharply, hitting a peak of 73 percent of GDP in 2009. It has declined significantly since the financial crisis, dropping 21 percentage points from 2009 to 2015, standing at 52 percent of GDP in late 2015. But the level of mortgage debt outstanding relative to GDP is still far above where it was before 2000 when the housing boom accelerated, so it may still need to drop before the housing market is restored to full health.
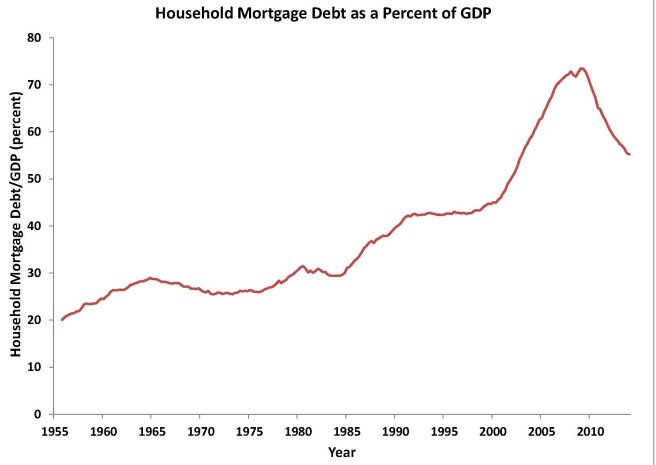
Chart: U.S. Household Mortgage Debt as a Percent of GDP
Source: Federal Reserve Board data on mortgage debt, rescaled by author using GDP from Bureau of Economic Analysis
