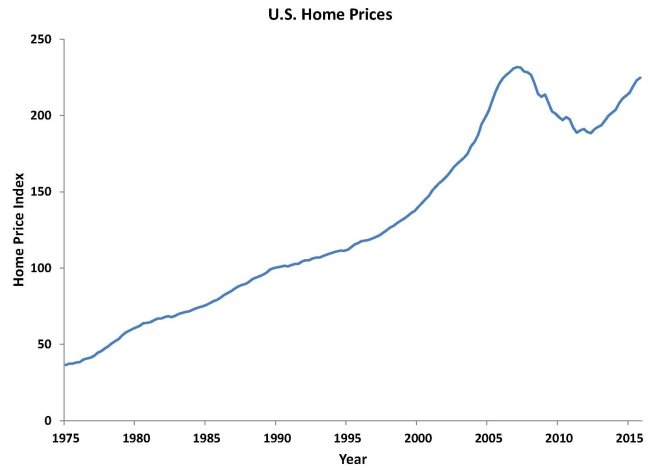
In the housing bubble in the early to mid-2000s, sensible ideas about how much debt a home buyer should take on were ignored by everyone—bankers and homeowners. Both foolish lenders and greedy homeowners were swayed by the fact that home prices had been increasing substantially over the past 10 years. If we look at Chart 1 showing quarterly data on national housing prices, you can see why they might be fooled. The chart plots a measure of prices of homes nationwide from 1975 to 2015. In the chart, you can see that until 2007, national house prices had never declined for more than one quarter in a row, and had increased in every year; so both lenders and homeowners were fooled into thinking that homes were a safe asset. Second, the appreciation in house prices from 2000 to 2005 averaged 8% per year. This led lenders and homeowners into falsely thinking that a homeowner’s income and ability to pay were no longer relevant. After all, if the home appreciated by 8% per year, it would be easy to sell the home and pay off the mortgage without a loss to either side. So, lenders started making sub-prime loans, which allow people to qualify for loans at percentages well below standard rules, such as those that limit the monthly housing payment to be less than 28 percent of a household’s income, and limit the total of a household’s monthly housing payment and payment on other debts (credit cards or student loans) to be less than 36 percent of its income. Some loans were even known as NINJA loans (because the homeowner had No Income, No Job, and no Assets). Those loans relied entirely on the appreciation of the home to be valid; as the home appreciated in value, the homeowner would borrow even more to pay off the original mortgage loan. But all of this sub-prime lending turned out to be foolish because it relied on the continued appreciation of house prices. When home prices began to decline in 2007, panic set in. Everyone began to realize that these loans would never be paid off. The worst part of the story is that sub-prime loans had the potential to greatly increase the homeownership rate among low-income households, but after the bubble burst, that dream vanished. So, the main benefit of allowing sub-prime lending in the first place, which was to increase homeownership among the poor, actually made things worse.
#UsingEconomics
Chart 1: U.S. Home Prices
Source: Federal Housing Finance Agency (FHFA) All-Transactions Home Price Index, rescaled by author